 Our Baker’s Dozen surveys deliver more than just rankings.
By Elizabeth Boudrie
Amid the confetti and cake celebrations of our 10th anniversary, I’ve been digging through the treasure trove of customer satisfaction data from the Baker’s Dozen surveys that we’ve collected across the past several the years.
Over the years, buyers of outsourced HR services have been kind enough to give us a view under their hoods, providing us with insights into their outsourced programs, the services they purchase, contracting and renewal details, their satisfaction, complaints, comments, compliments, and suggestions.
We’ve learned a lot—actually far too much to fit into this space. But we’ve culled some of the more notable findings.
By the Numbers
HR outsourcing programs are generally growing—or at the very least buyers’ willingness to share their thoughts is on the rise.
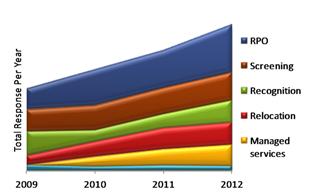
• Our RPO survey generates the most response every year, and it’s the highest growth survey over the past four years.
• Relocation, although not the largest of our surveys, has grown at the same rate as RPO over the same time period.
• Managed services, first introduced in 2010, was strong out of the gate and has continued to gain in response over the years.
• Screening is the second largest in terms of response and remains a strong growth survey, although its growth is smaller than others.
• Recognition has seen steady growth over the past three years.
Over time, we’ve discontinued surveys that either become too small or simply didn’t lend themselves well to the process. Enterprise HRO stands out as an example of the former. We discontinued that survey a few years ago, as fewer and fewer buyers committed to full enterprise programs, hence fewer respondents to participate in our poll.
Satisfaction, (Largely) Guaranteed
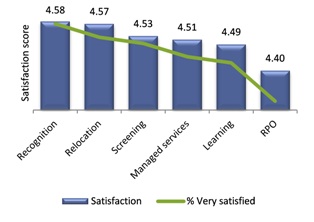
Satisfaction levels are generally fairly high. Across all satisfaction elements common to all years and all outsourcing program areas, satisfaction scores have remained near 4.5 on a 5-point scale. Surveys are distributed to buyers whom providers hand-select, as well as a large group from our own lists. However, those numbers are certainly valid on a comparative basis, and they have remained steady across all years of research.
Satisfaction is highest among buyers of outsourced recognition services (4.58 out of 5) and lowest among buyers of RPO services (4.40). The difference is the “very satisfied” response category; there’s a 17-point swing between recognition and RPO buyers who say they are very satisfied.
Across all programs, satisfaction is highest in companies headquartered in North America, followed by Asia Pacific (APAC), and then Europe/Middle East/Africa (EMEA).
In general, across all years and all outsourcing programs, providers have succeeded in building trust between the buyers and the executives assigned to the engagement as well as the team members working on the account. Buyers also give providers highest scores in honoring their commitments.
The data shows one area where providers could improve: responding to buyer criticism. A new approach to communicating and executing on buyer feedback and requests for changes or improvements to existing outsourced programs might help increase satisfaction levels.
Best Performers vs. the Rest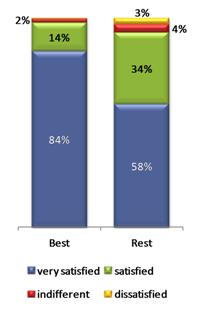
“Hyper-satisfaction” is the difference between the best performing providers and the rest. The best performing providers across all types of outsourced programs (which we’ve defined as the providers in the top 10 percent of performance scores across all satisfaction data elements) outperform the rest in “very satisfied” scores by 26 points.
Satisfaction gaps between the best and the rest are smallest in what we consider “table-stakes” areas, things like meeting SLAs and honoring commitments. Providers simply must do well in these areas to attract and retain clients. The largest satisfaction gaps are in team performance and overall outsourcing experience.
Perhaps not surprisingly, the best providers tend to be serving companies with a single location; the “rest” tend to have many more clients with 10-plus locations.
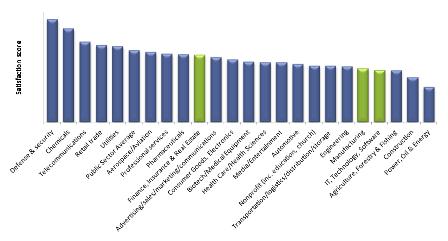
Buyer Industries
Looking across our data through the buyer industry lens, utilization is highly concentrated: Three industries—finance, insurance and real estate; IT, technology and software; and manufacturing—make up more than 60 percent of total buyers across all outsourcing programs.
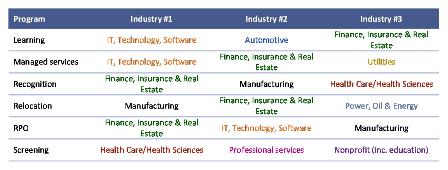
Utilization, however, doesn’t necessarily lead to higher satisfaction levels. Satisfaction among these three industries is comparatively low.
As I noted at the outset, we’ve collected a lot of provider and buyer data over time–too much to do justice to here. If I’ve piqued your interest and you want to know if we have access to data not presented here, reach out to me; I’m happy to throw open the treasure chest to look for more gems.
Elizabeth Boudrie is executive director of the HRO Today Institute and vice president of research for SharedXpertise.